Street view data
Large-Scale Street View Data Collection and Processing
Acquire and process street-level imagery across cities, countries or global samples. We audit coverage, design the sampling frame, collect through permitted APIs or licensed and open sources, run quality control, and deliver traceable imagery metadata, spatial layers and derived indicators.
Overview
From a study area to a usable street view dataset
Large-scale street view data collection starts before the first image request. Give us a boundary, road network or list of locations and we turn it into a controlled sampling frame, test which sources actually cover it, estimate request volume and cost, and document what may be stored, processed and delivered under each source's terms.
We then run the collection as a monitored data pipeline rather than a browser scraper: metadata first, imagery only where permitted, retries and deduplication recorded, placeholders and poor frames rejected, and every accepted item tied to its requested coordinate, matched panorama, heading, capture date and licence provenance. The same workflow can cover one city, a national road sample or locations distributed across multiple countries.
Processing is optional and modular. We can deliver a collection manifest and permitted imagery package, or continue through panorama reprojection, semantic segmentation, object detection, OCR and spatial aggregation. Sampling parameters, model versions and validation results travel with the output, so every derived indicator can be traced back to the source record that produced it.
Imagery platforms
Street view sources selected by coverage, scale and licence
No platform is a universal bulk feed. We audit coverage and access before collection, then use documented APIs, open licences, client-owned capture or commercial agreements that fit the required geography and deliverable.
Google Street View
The main source outside mainland China where coverage is available. We use Google's documented Street View interfaces for metadata and permitted image requests, control quota and cost at scale, and define storage and delivery around Google's platform terms.
Baidu Street View (China)
The practical source for projects in mainland China. We handle BD-09 coordinate conversion, sample along the road network and record the imagery dates and coverage actually returned for the study area.
Apple Maps Look Around
An additional source in cities and regions covered by Look Around. We first verify coverage and the access or usage permitted for the project, then standardise available imagery and metadata into the same sampling scheme.
KartaView
An open, contributor-built source of geotagged street-level tracks. We can collect track metadata and ordered frames, retain contributor and licence provenance, and process them through the same detection and indicator pipeline.
Real output
Output from a real sample point
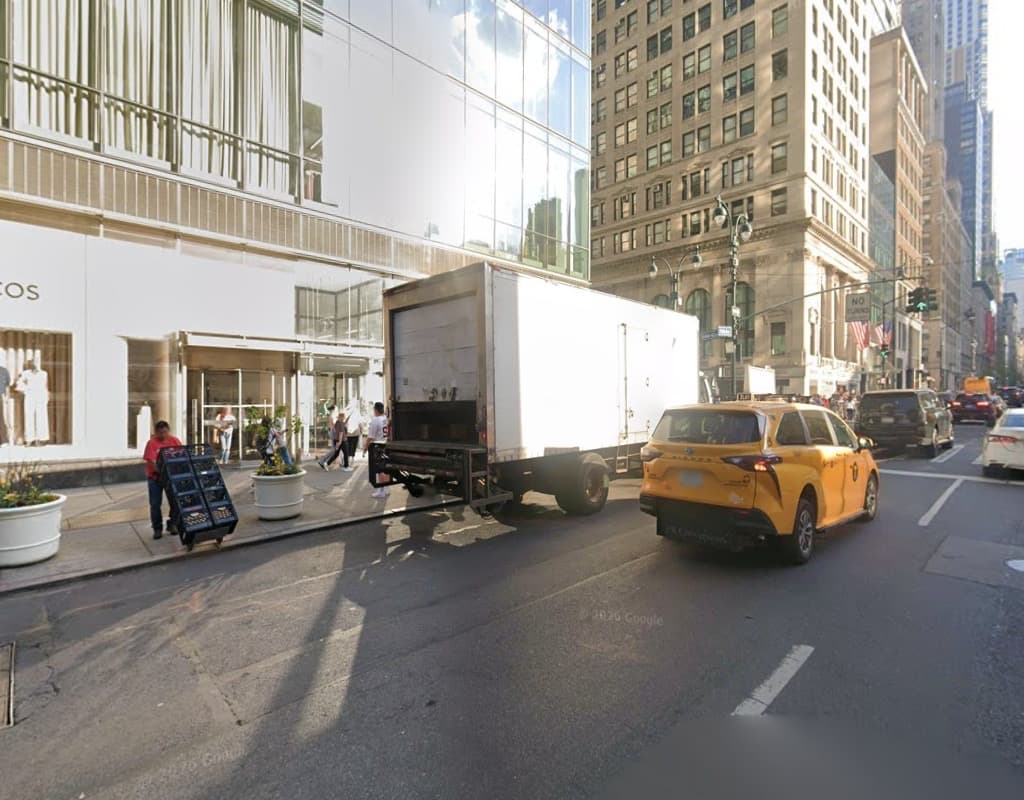
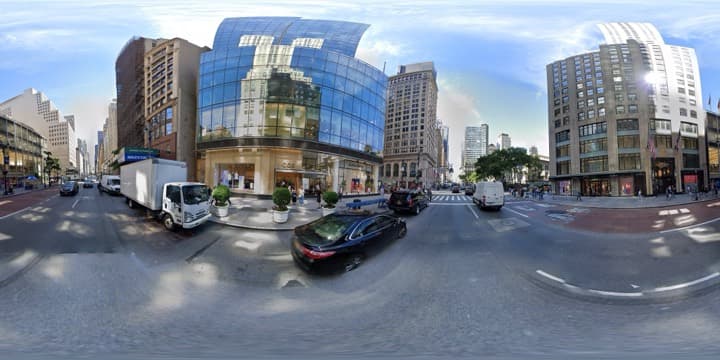
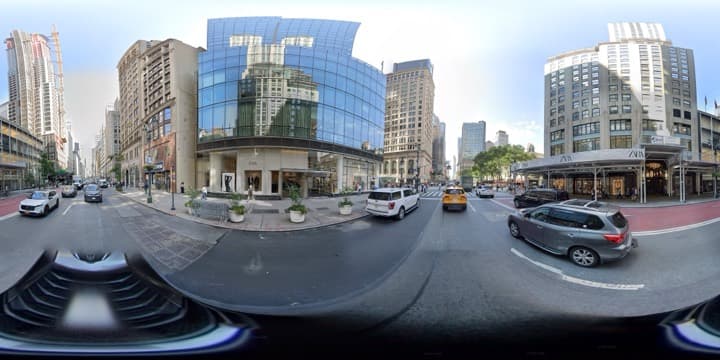
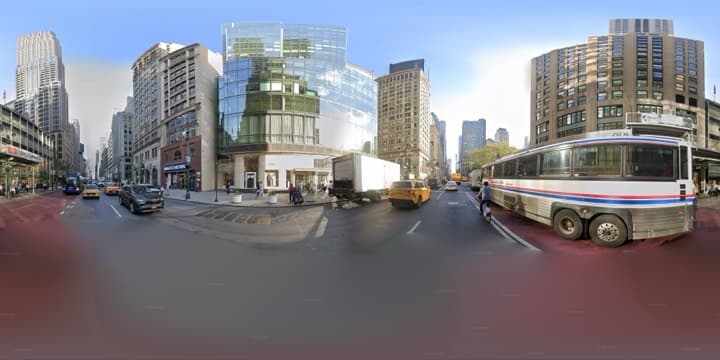
One point on Fifth Avenue in New York, at 40.7536, -73.9804. Everything below came out of the same pipeline that runs on a full project; only the scale differs. The same pipeline also runs on Baidu, Apple Look Around and KartaView imagery when those are the better source for the area.
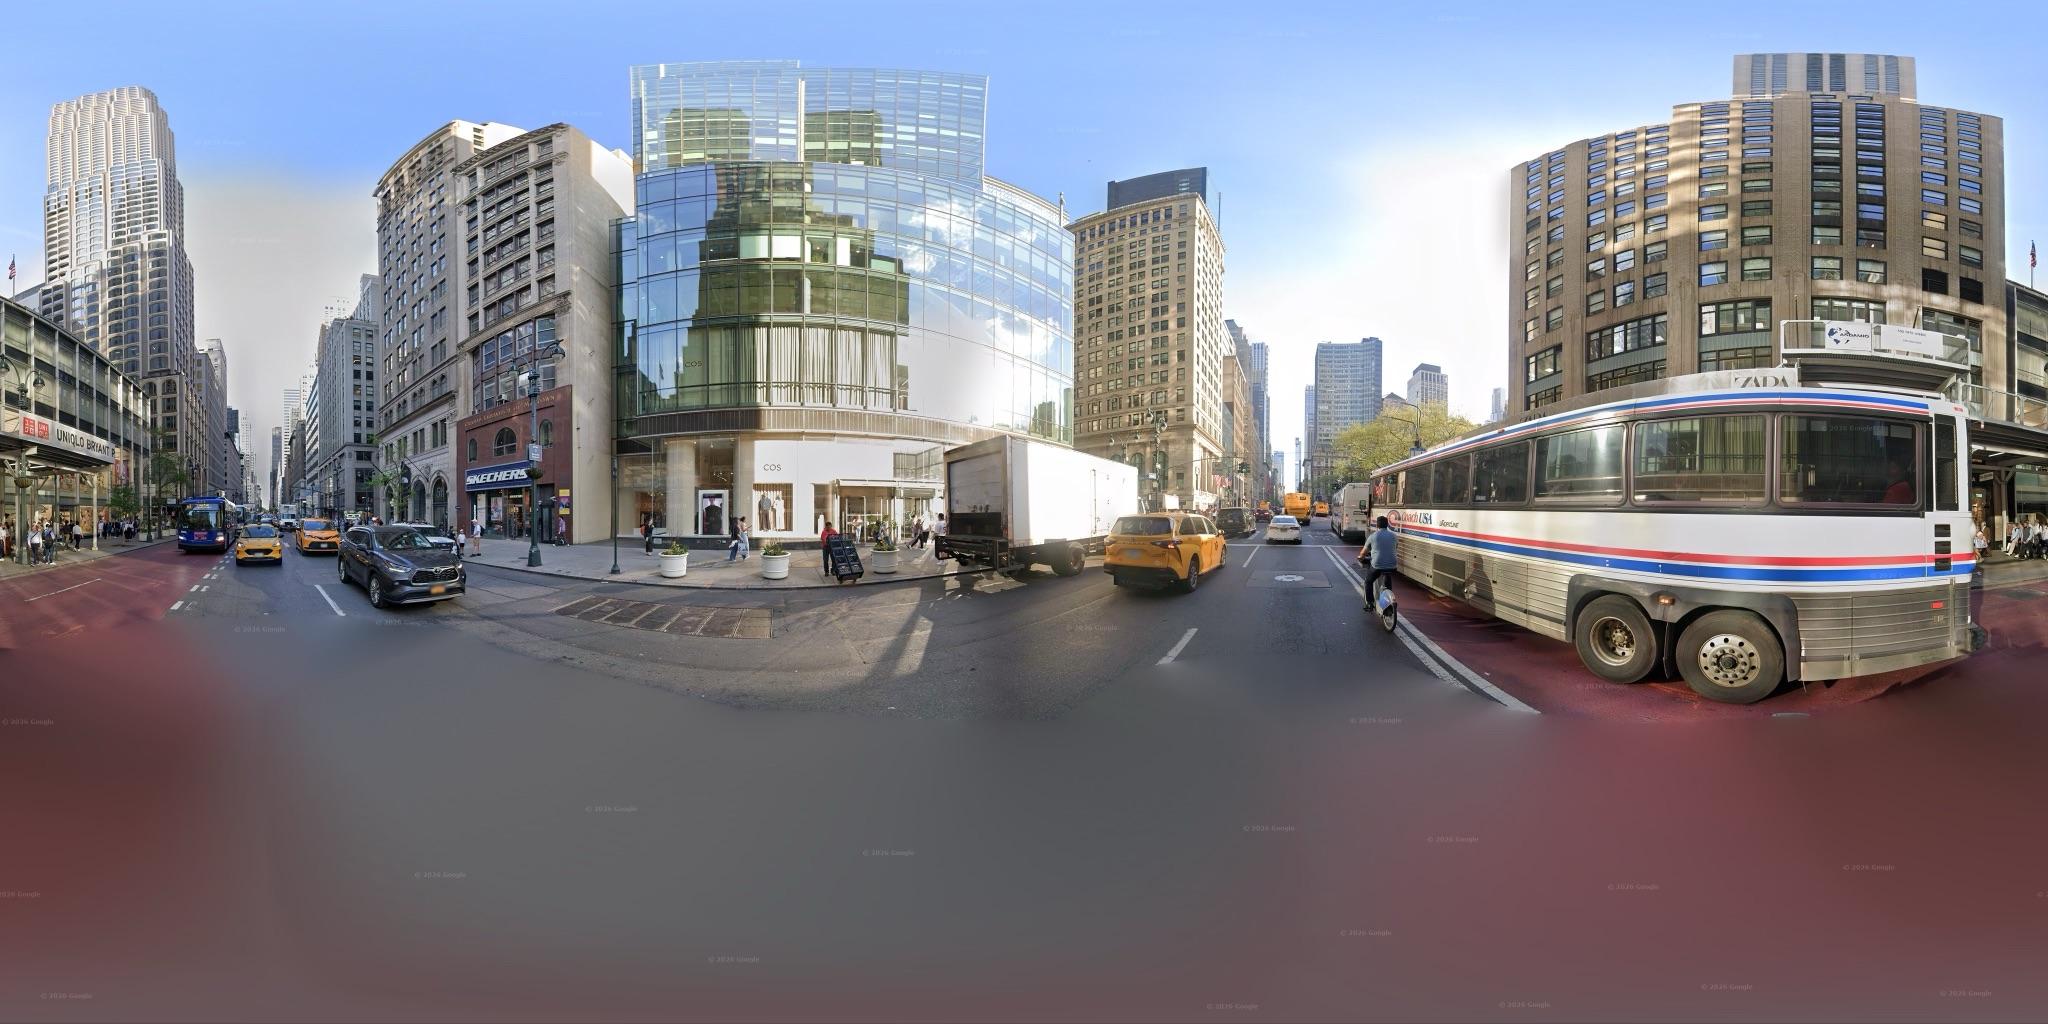
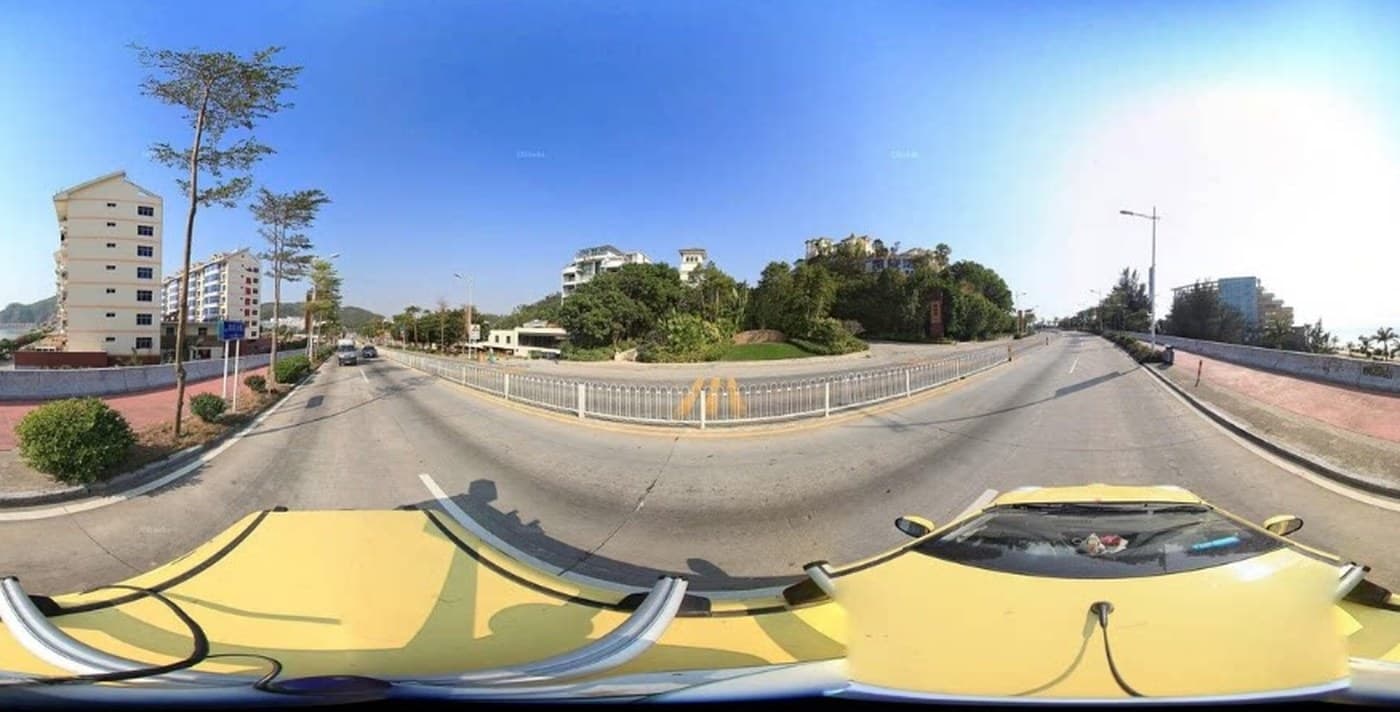
The full panorama
A 360° equirectangular image at 4096 × 2048, which is the frame every indicator is measured from. Working from the panorama rather than a single snapshot means no part of the street is outside the field of view.
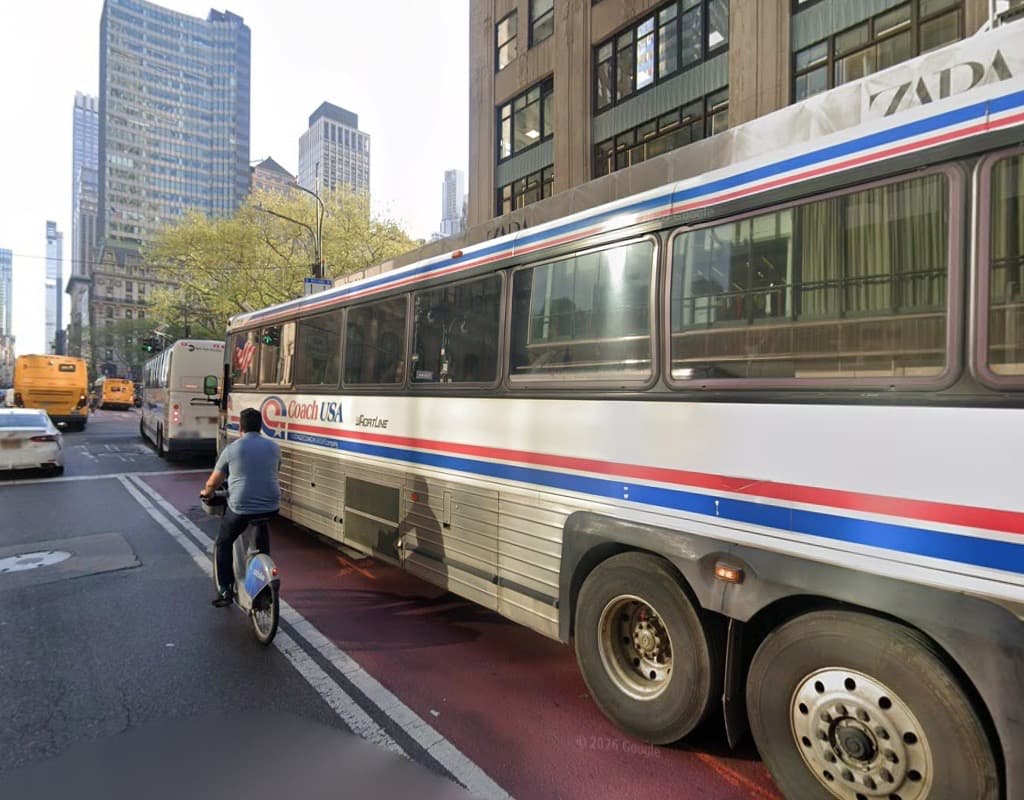
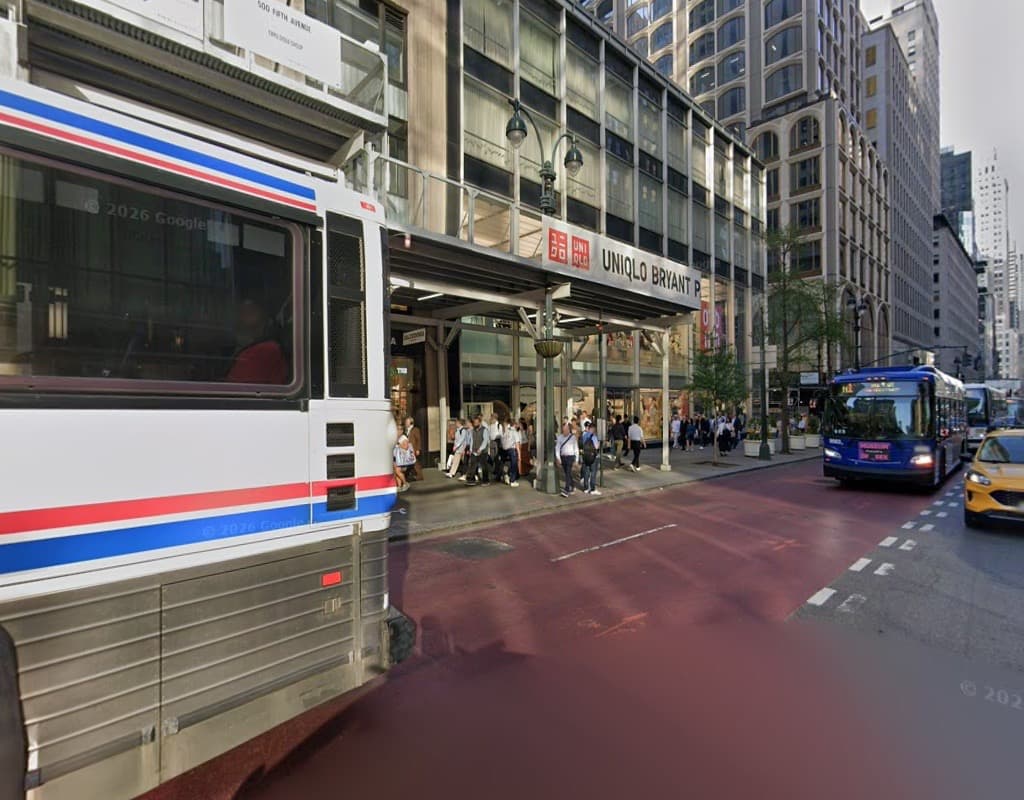
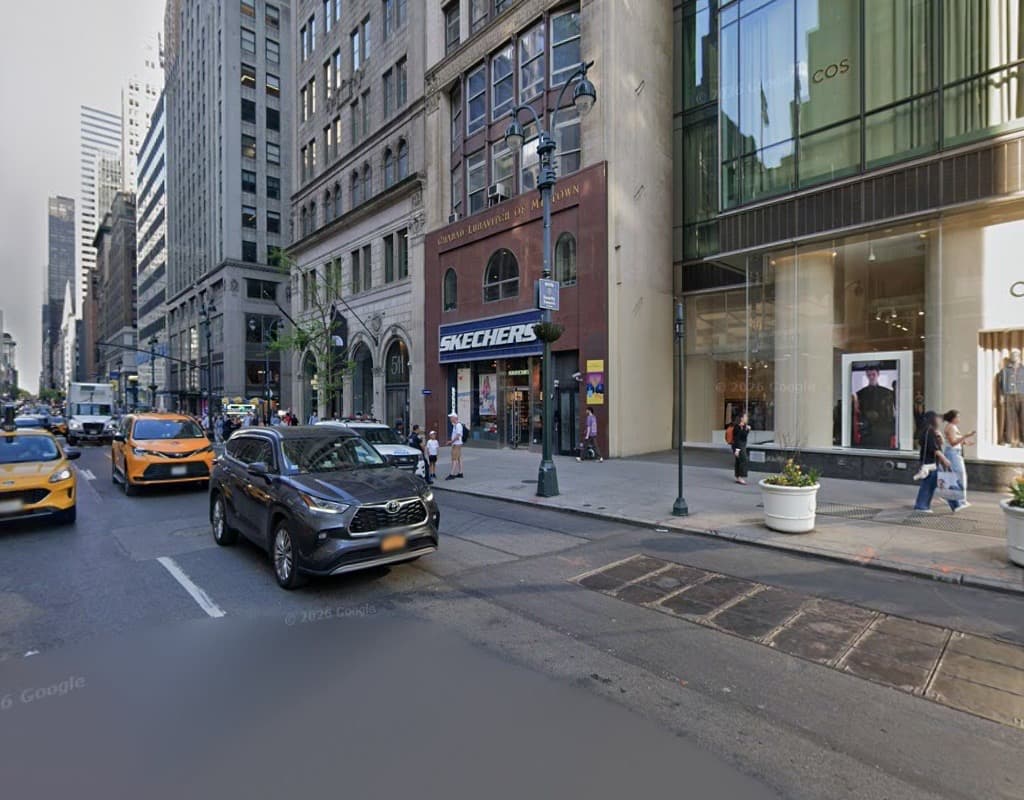
Split into four headings
The same point rendered at 0°, 90°, 180° and 270°. Indicators are computed per heading and then averaged, so a single camera direction cannot decide how green or how enclosed a street appears.
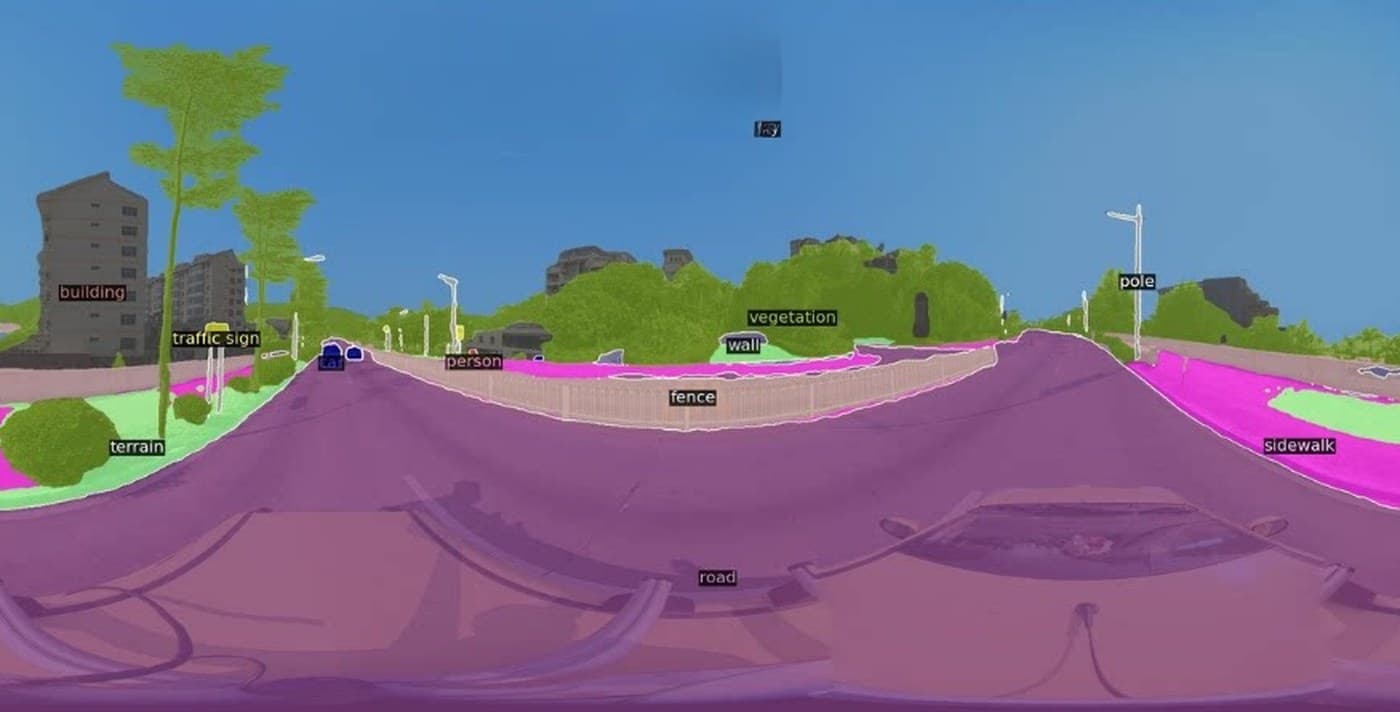
Segmented into classes
Every pixel is assigned to a class — road, sidewalk, building, vegetation, sky, person, pole, fence — and the class shares become the green view index, the enclosure ratio and the rest of the indicator set.
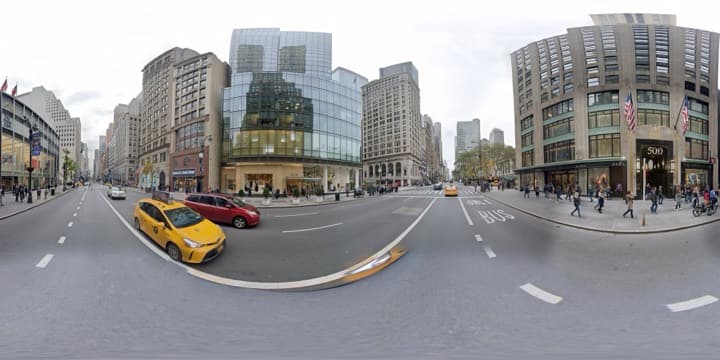
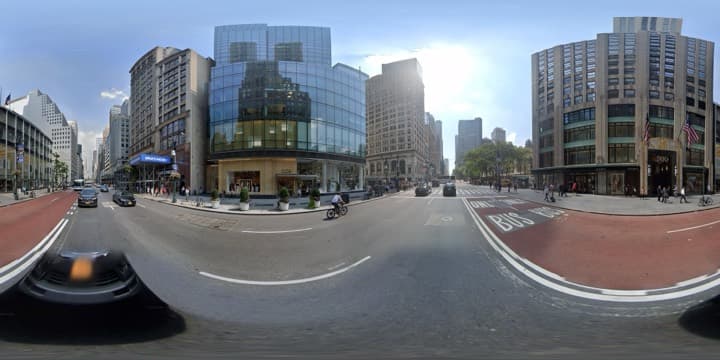
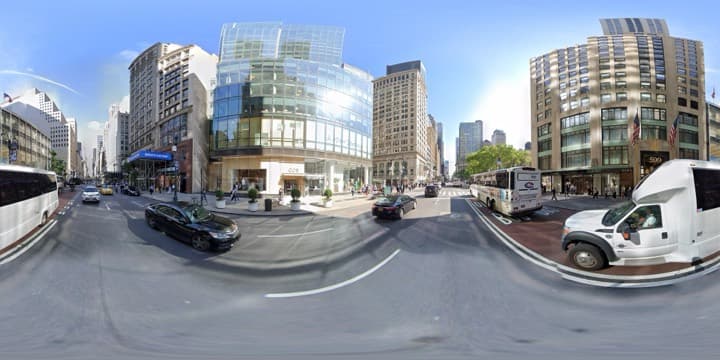
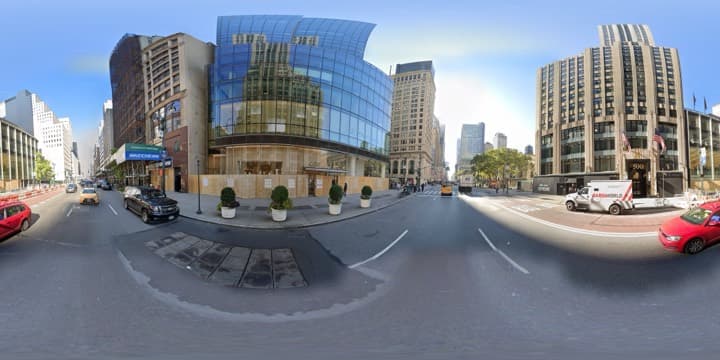
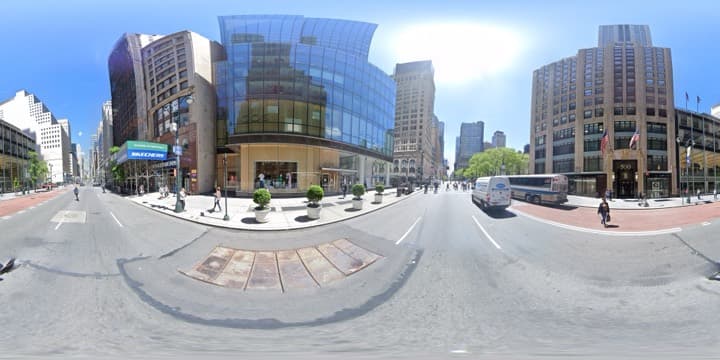
Ten years of the same point
Eight capture dates returned for this location between 2017 and 2026. Re-running one sampling design across vintages is what turns a snapshot into a change measurement; note the gaps, since platforms do not revisit every street every year.
KartaView as an imagery source
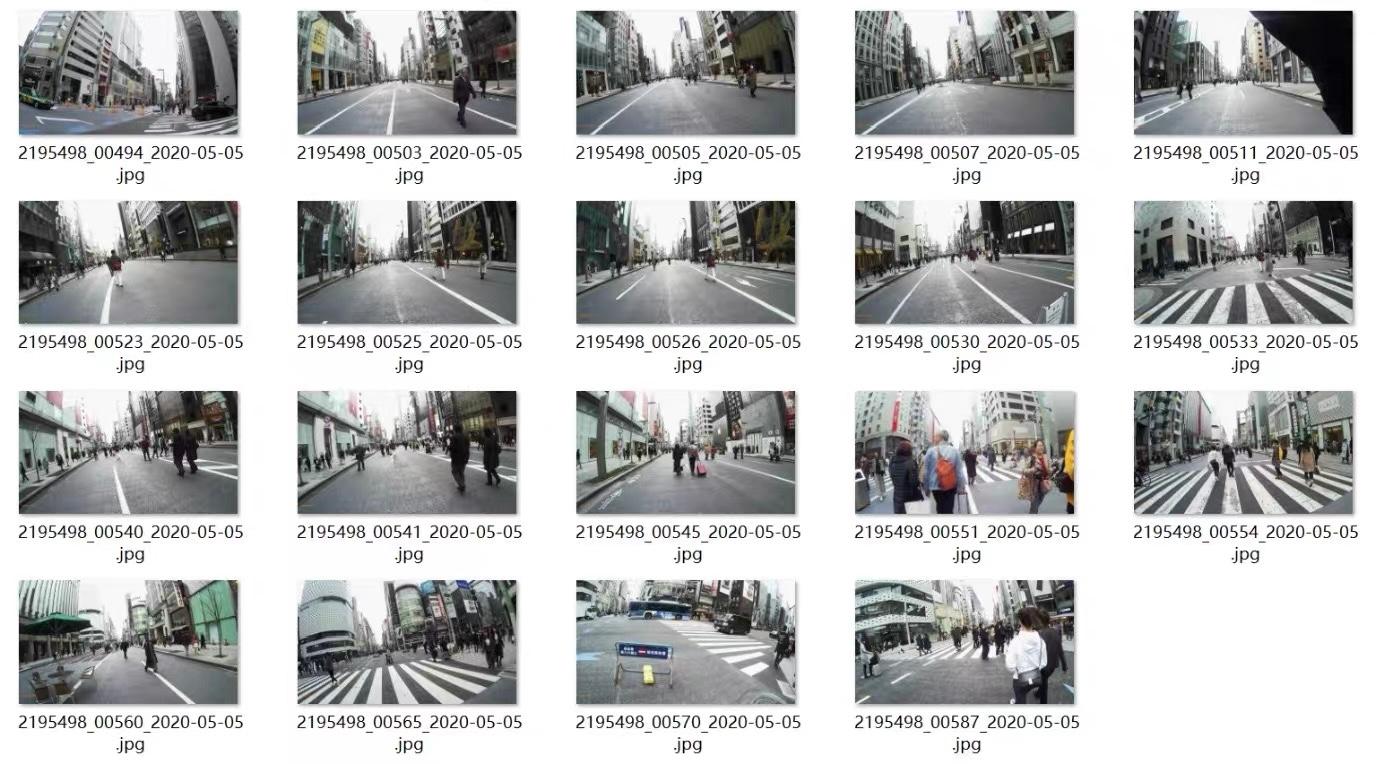
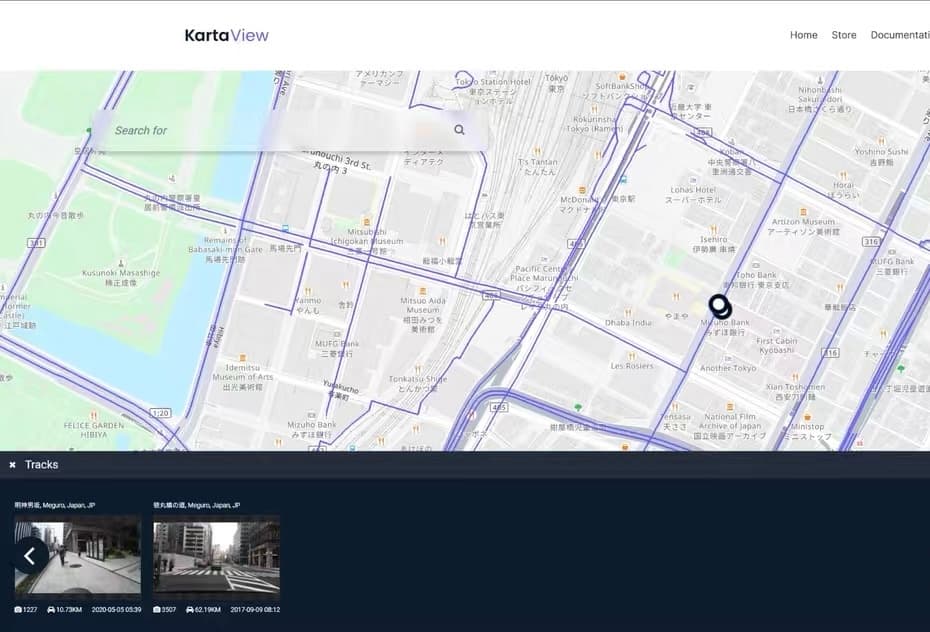
Alongside Google, Baidu and Apple, we also pull open street-level tracks from KartaView. Left: coverage on the map, with each blue path marking a recorded track. Right: the raw frame sequence behind one track — ordered, timestamped images that feed the same indicator pipeline.
Panoramic and perspective imagery © Google, retrieved through the Street View Static API under its terms of use. KartaView coverage and sequence frames © their respective contributors, shown here as an example of an open street-level source. Segmentation output is our own, produced with an open urban-scene model.
Scope
Core data delivery, plus optional street view analytics
Collection and analysis are one modular workflow. Start with a traceable street view dataset, then add only the processing your project needs — from segmentation and green view index to urban perception, walkability, asset inventory and change detection. Outputs can be produced per image, point, street segment or district.
Core collection deliverables
Collection manifest
One record per requested view with request coordinates, matched panorama or frame id, status, source, capture date, heading, file reference and QA outcome.
Permitted imagery package
Geotagged images or ordered frames when the source licence, commercial agreement or client ownership permits redistribution.
Spatial sample layer
Stable point and street-segment identifiers with coordinates, headings, source coverage and capture dates.
Method and QA record
Sampling interval, source rules, retries, model versions, thresholds and validation results delivered with the data.
Optional value-added analysis
Semantic segmentation
Pixel-level classes such as road, sidewalk, building, vegetation, sky, person and vehicle, with class shares retained per frame.
View method and examplesGreen view and spatial form
Green view index, sky visibility, enclosure and frontage composition measured consistently across headings and aggregated to the road network.
View method and examplesUrban perception modelling
Locally validated perception scores such as safety, beauty or liveliness, reported as modelled human judgement rather than objective fact.
View method and examplesWalkability and accessibility audit
Visible sidewalks, crossings, kerbs, steps, obstructions and pedestrian provision converted into reviewable route or segment indicators.
View method and examplesObjects and street assets
Vehicles, pedestrians, signs, lights, benches, bins, poles and crossings detected, located and deduplicated across overlapping frames.
View method and examplesStorefront and signage intelligence
OCR and visual detection used to identify shopfronts, read signs and reconcile what is visible on the street with a POI layer.
View method and examplesRoad and pavement condition
Visible surface defects, sidewalk continuity and accessibility issues flagged for review, with confidence and source frame references.
View method and examplesMulti-date change detection
Comparable vintages aligned by location and view to identify changes in greenery, frontage, assets or the built environment over time.
View method and examplesSpatial aggregation and mapping
Image-level results joined to points and street segments, summarised by district or catchment, and supplied as GIS layers or interactive maps.
View method and examples
Output formats
Delivered the way your stack expects
- CSV
- One row per sample point, plus a second table aggregated to segment level.
- GeoJSON
- Sample points and indicator-joined street segments in EPSG:4326.
- Shapefile
- Point and line layers with projection metadata for ArcGIS and QGIS workflows.
- Excel
- Workbook with indicators, segment aggregation, method note and validation sheets.
- Image manifest
- Every processed image listed with its source, licence and capture date, so the provenance of each number is auditable.
Use cases
What clients use it for
- Streetscape and greenery assessmentScore an entire network on greenery, enclosure and openness instead of hand-scoring a sample of streets.
- Retail frontage censusRead what is actually trading on a high street and reconcile it against a POI layer that may be out of date.
- Site quality scoringJudge candidate locations on what the street physically looks like, not only on what the catchment numbers say.
- Asset and furniture inventoryBuild a located inventory of street furniture and crossings from imagery rather than from a field survey.
- Indicator mappingPublish the results as a map where a committee can switch indicators and inspect any segment.
Sample dataset
What you actually receive
Sample project data. Points were sampled every 25 metres with four headings each; the capture month is carried through because vegetation indicators are not comparable across seasons.
| Segment | Points | Green view % | Enclosure | Storefronts / 100 m | Vehicles / img | Captured |
|---|---|---|---|---|---|---|
| Mill Lane | 48 | 34.2 | 0.68 | 1.2 | 1.8 | 2025-07 |
| Harbour Road | 126 | 11.7 | 0.39 | 0.4 | 7.4 | 2025-07 |
| Beech Street | 62 | 29.5 | 0.91 | 2.1 | 2.6 | 2025-08 |
| Market Row | 34 | 6.8 | 1.71 | 9.6 | 3.1 | 2025-08 |
| Vale Crescent | 71 | 41.3 | 0.55 | 0.0 | 1.2 | 2025-07 |
| Foundry Way | 58 | 9.4 | 1.48 | 3.8 | 11.2 | 2025-06 |
How it works
Five steps, every project
- Step 01
Send the target geography
Provide a boundary, road network or location list, plus the source preferences, date constraints and outputs you need.
- Step 02
We audit coverage and access
We test platform coverage, image age, API or licence constraints, expected request volume and the gaps that need an alternative source.
- Step 03
We design the collection
We agree sampling interval, headings, source priority, deduplication rules, QA checks, processing modules and permitted deliverables.
- Step 04
We collect and process at scale
A monitored pipeline retrieves permitted imagery and metadata, handles quota and retries, rejects bad frames, and runs the selected processing stages.
- Step 05
We validate and deliver
You receive the collection manifest, permitted imagery or derived layers, QA summary, method note and validation results.
Projects are priced on target geography, sampling density, expected image volume, platform fees or licensing, QA depth and processing modules. Send the boundary or location list and required deliverables; we audit coverage and return a written scope and fixed price before collection starts.
FAQ
Questions we get asked
Can you collect street view data at city, national or global scale?
Yes. The unit can be every fixed interval on a road network, a representative sample of roads, or a supplied list of locations across multiple countries. Before quoting, we run a coverage and access audit because platform quotas, image age, licensing and gaps determine the practical scale. The collection pipeline records status, retries, duplicates and QA outcomes so a large job remains reproducible rather than becoming an untraceable folder of images.
Where does the imagery come from?
We collect across multiple street-view platforms, chosen per project and always within each platform's terms: Google Street View (Street View Static API) outside mainland China; Baidu panorama inside mainland China; Apple Maps Look Around where coverage and licence allow; and open imagery platforms such as KartaView and Mapillary, which publish under Creative Commons licences. We can also process imagery you already own or capture yourself, or commercially licensed imagery bought for the project. We do not bulk-download imagery from platforms that prohibit it, and we will say at the enquiry stage if the source you have in mind cannot be used the way you are imagining.
Do you cover streets inside mainland China?
Yes, through Baidu's panorama API, which is the practical source there since Google has no coverage. The workflow is the same — sample points along the network, retrieve fixed headings, measure the same indicators — with two differences worth planning around. Coordinates need converting between WGS 84 and the BD-09 system the platform uses, which we handle and document. And historical vintages are far less consistently available than Google's, so change-over-time studies are something we scope against what the platform actually returns for your area rather than promise up front.
Can you deliver the images themselves, or only the numbers?
The indicators are always yours to keep. The imagery depends on where it came from: open-licensed and client-owned imagery can be delivered with the dataset, while imagery retrieved through a platform API is governed by that platform's caching and redistribution terms, so what you receive is the derived measurements plus a manifest identifying each source image. We confirm which case applies before work starts, in writing.
How accurate are the indicators?
We validate every project against a manual sample scored by hand. On a typical greenery index the automated and manual scores agree within about three percentage points, which is sufficient for comparing streets against each other and not sufficient for treating any single value as an absolute truth. The validation result is delivered with the data rather than described in general terms.
How often can it be refreshed?
As often as the underlying imagery is refreshed, which for platform sources is typically every one to three years in dense urban areas and less often elsewhere. Re-running the same sampling design against new imagery gives a genuine change measurement; we report which points actually have newer imagery rather than silently mixing vintages.
Can you use imagery we captured ourselves?
Yes, and it is often the better option. Dashcam footage, 360 camera runs or an existing image library can all be processed, provided positions and headings are recoverable. Your own capture removes licence restrictions on redistribution, fixes the capture date to a moment you chose, and lets you cover streets the platforms have not visited recently.
More services
Often combined with
Semantic Segmentation
Pixel-level image analysis that turns imagery into counted, measured classes.
Learn MorePOI Data
Business and point-of-interest records with categories, coordinates and attributes.
Learn MoreGoogle Maps Data
Structured business listings with coordinates, categories, ratings and opening hours.
Learn MoreKeep exploring
Where to go next
Related services
- GIS AnalysisSpatial analysis and geographic data processing, from overlays to network models.
- Geospatial DataLocation, road, boundary and land-use datasets, cleaned and projected correctly.
- POI DataBusiness and point-of-interest records with categories, coordinates and attributes.
- Map VisualizationInteractive maps and data visualization built for clarity and fast loading.
Related reading
- How to Collect Google Street View DataThe official route starts with free metadata, then permitted image requests. At city scale, sampling, quota, cost, retries, QA and a traceable manifest become the real collection job.
- Street View Data Collection Platforms ComparedTen platforms in five families, compared for real data collection work. Coverage, documented access, quotas, licensing and permitted delivery determine whether a source can support a city-scale or global project.
- Planning Large-Scale Google Street View CollectionBefore collecting thousands of images, use free metadata requests to measure coverage, image age and expected volume across the whole sampling frame.
- Street View Data Processing and ApplicationsAfter acquisition and QA, street view imagery moves through visual extraction and spatial aggregation. Each processing layer determines what the final dataset can support.
- Street View Data Processing with Semantic SegmentationCollection is only the first stage. A large street view image set becomes usable data when headings, classes, seasonality and validation are controlled across the whole pipeline.
Next step
Have a specific data requirement?
Tell us the geography, the fields and the cadence you need for street view data. You get a scoped plan, a sample and a fixed price before any work starts.