Map data collection
Google Maps Data Collection
Get structured business and location data for research, market analysis and location intelligence.
- Restaurants · 34
- Cafés · 22
- Retail · 26
Overview
Map listings, turned into an analysis-ready dataset
Map platforms hold the most complete public record of where businesses actually are: their category, their address, their coordinates, how people rate them and when they are open. That record is designed to be browsed one listing at a time, which makes it almost useless for analysis at city or country scale.
We turn that record into a table. You define the geography and the categories you care about; we return one row per business with consistent field names, validated coordinates and a clear note on which fields were unavailable rather than silently blank.
Coverage is defined by a search geometry rather than a keyword, so a request for restaurants in Greater Boston is systematically tiled across the metro area instead of returning whatever the first page of results happened to show.
Real output
How we prove a collection is complete
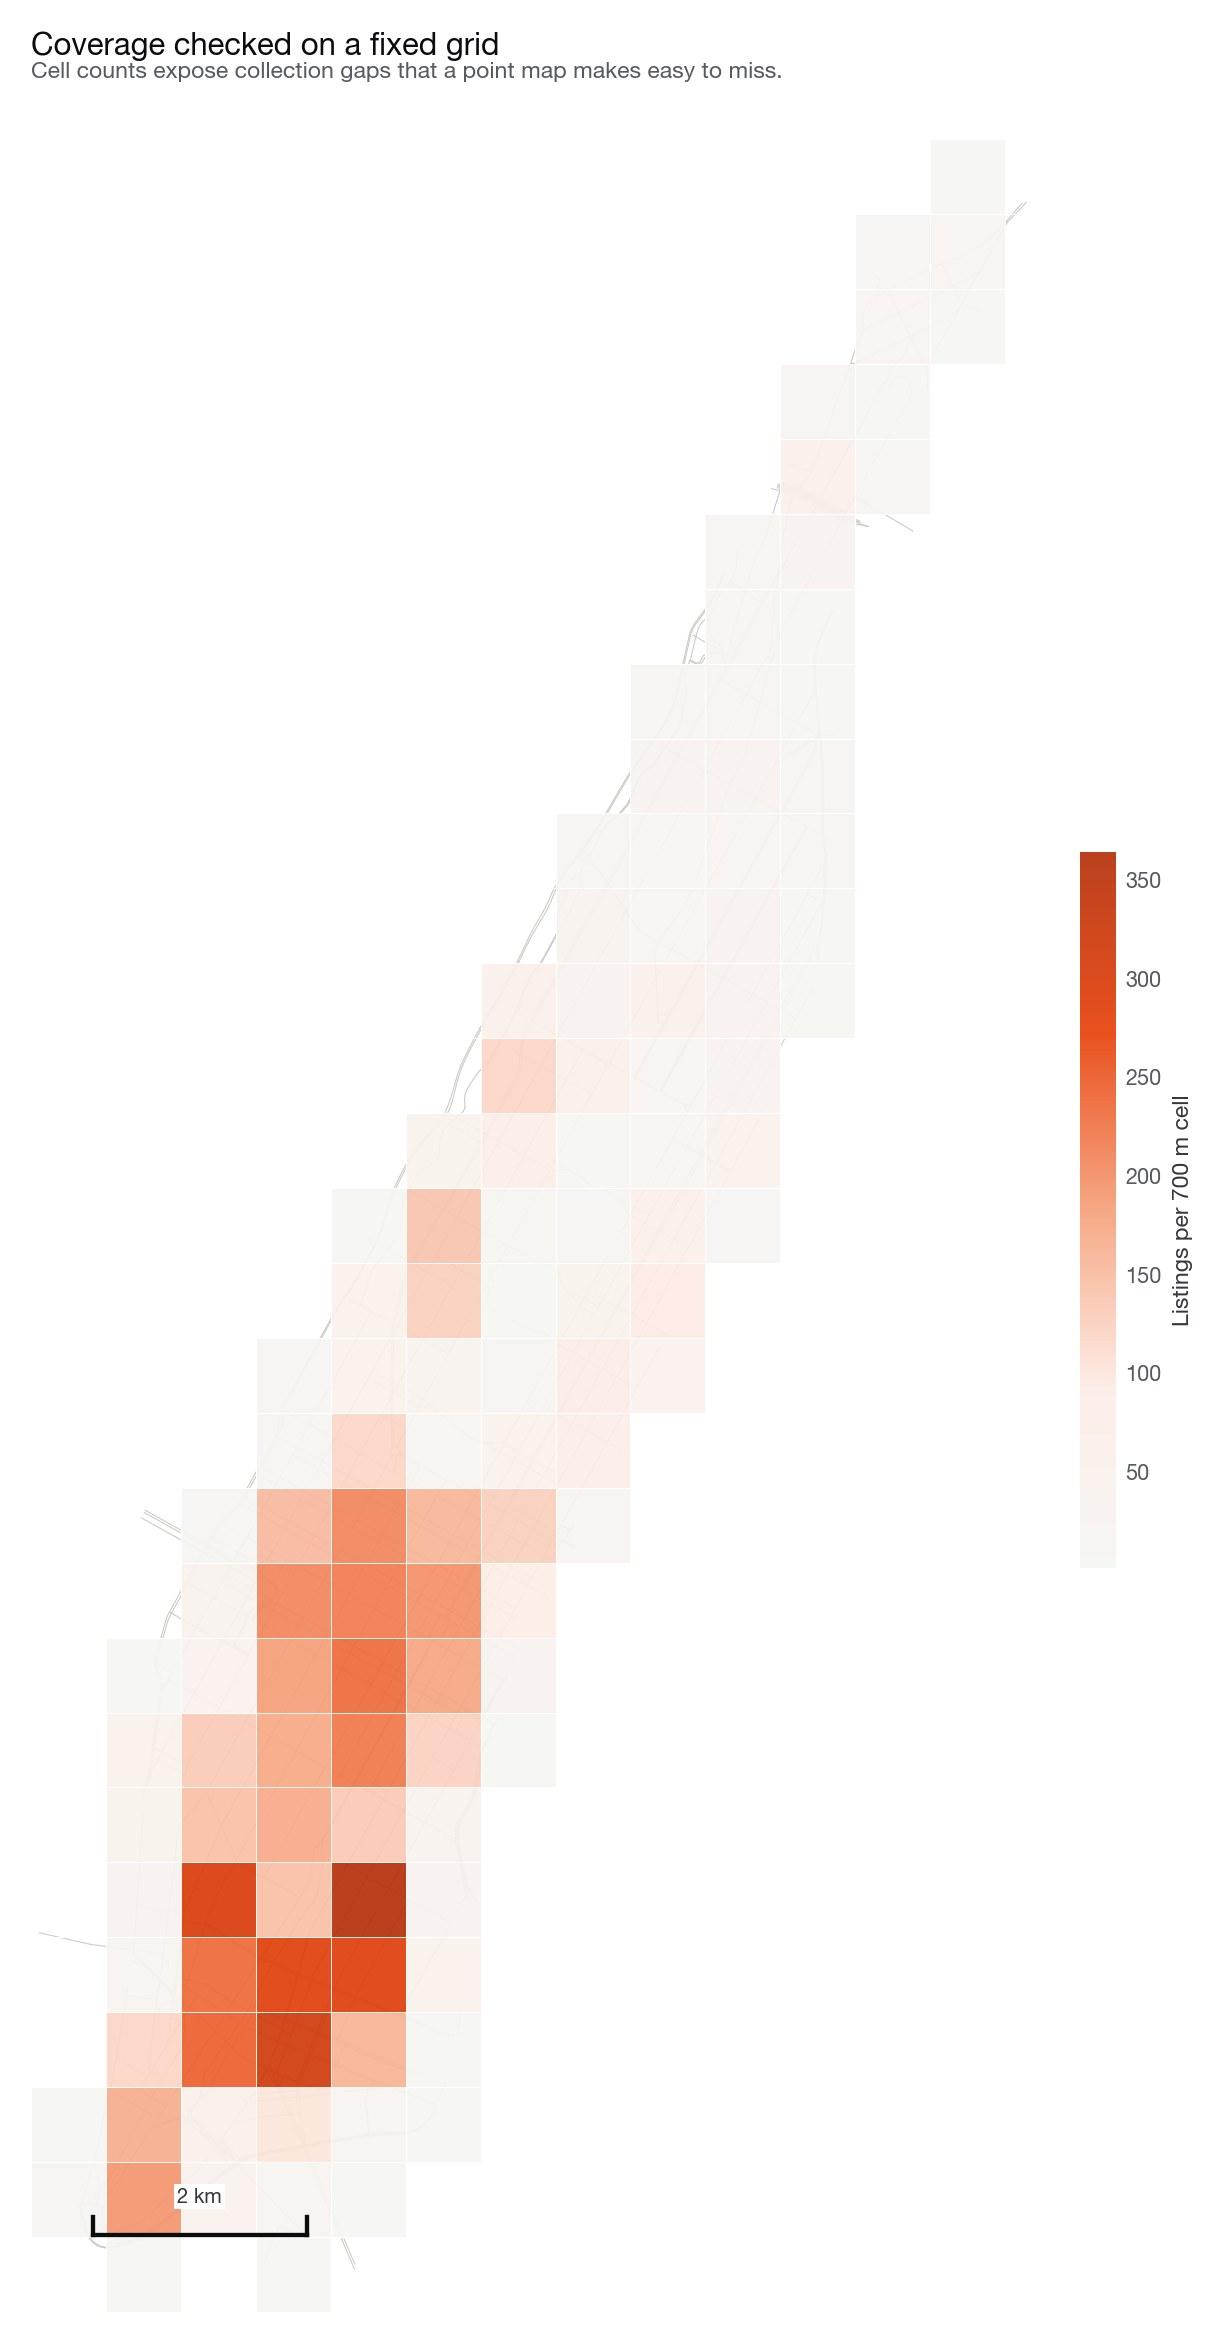
Two checks we run on every listings project, shown here on an open dataset of 8,628 Manhattan businesses. A record count on its own tells you nothing about whether the collection actually finished.
Coverage checked cell by cell
The area is divided into fixed 700 m cells and listings are counted in each one. A run that stopped early, a district that silently returned nothing, or a query that hit a result cap all show up here as cells that are empty when the streets around them are not.
Field completeness, broken down by category
The same extract, category by category. Names are near-universal; opening hours, websites and phone numbers are not, and how far they fall varies by category. This is the difference between a dataset you can plan around and one that surprises you halfway through.
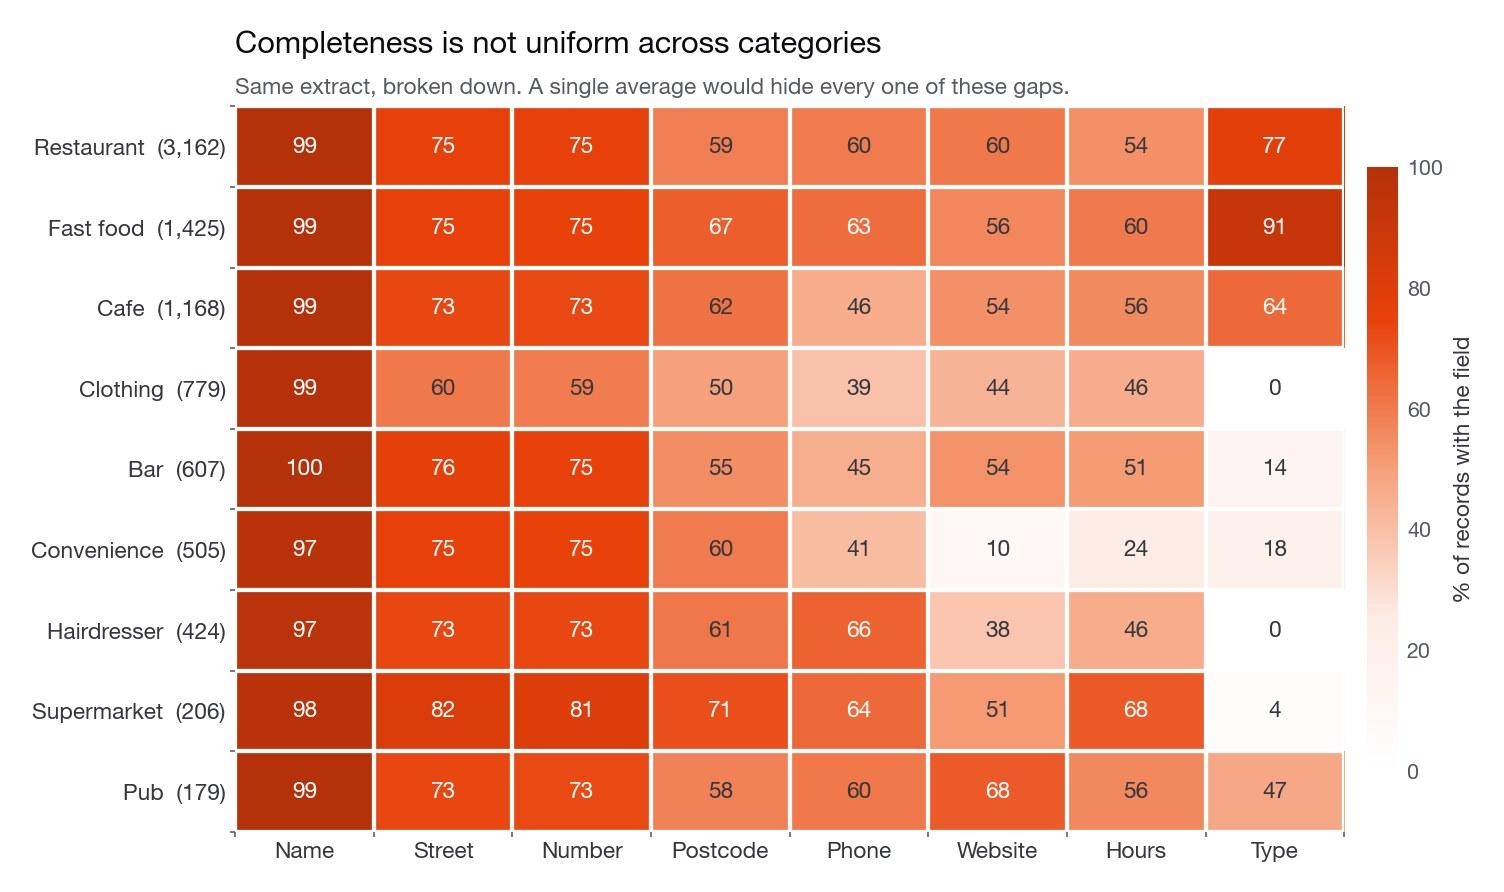
Data © OpenStreetMap contributors, under the Open Database Licence. Shown because it can be published openly; the same checks are run on the platform data collected for your project.
Scope
What we can collect
Fields available for a typical business listing. We confirm which of these are present for your target geography before the project starts.
Business name
Listing name as published, with original casing preserved.
Category
Primary category plus secondary categories where published.
Address
Full formatted address, split into street, city, region and postcode.
Latitude
Decimal degrees, WGS 84, validated against the stated address.
Longitude
Decimal degrees, WGS 84, checked for null-island and swapped-axis errors.
Phone
Published contact number, normalised to E.164 where a country is known.
Website
Listed website URL, with tracking parameters stripped.
Rating
Average published rating at the time of collection.
Reviews
Published review count, and review text where the project scope allows it.
Opening hours
Weekly schedule normalised into a structured, machine-readable form.
Price level
Published price indicator where the category supports it.
Permanently closed flag
Listings marked as closed, so you can exclude or study them.
Output formats
Delivered the way your stack expects
- CSV
- UTF-8, one row per business. The default for spreadsheets and quick analysis.
- Excel
- Formatted workbook with a data sheet, a field dictionary and a coverage summary.
- JSON
- Nested records that keep opening hours and category arrays intact.
- GeoJSON
- Point features in EPSG:4326, ready for QGIS, Mapbox, Leaflet or deck.gl.
- Shapefile
- Point shapefile with a projection file, for ArcGIS and legacy GIS stacks.
Use cases
What clients use it for
- Competitor analysisMap every competitor in a metro area, then compare density, ratings and opening hours by neighbourhood.
- Retail researchTrack how a chain's footprint changes over time by re-collecting the same geography on a schedule.
- Location intelligenceJoin map listings with demographics and mobility data to score a trade area.
- Site selectionRank candidate addresses by nearby demand generators, competitor saturation and category gaps.
Sample dataset
What you actually receive
Sample project data. Values illustrate the schema and formatting we deliver; they are not a real client dataset.
| Business name | Category | City | Latitude | Longitude | Rating | Reviews |
|---|---|---|---|---|---|---|
| North End Trattoria | Italian restaurant | Boston | 42.36372 | -71.05489 | 4.6 | 1,284 |
| Harbor Oyster House | Seafood restaurant | Boston | 42.35921 | -71.05114 | 4.4 | 2,031 |
| Cambridge Coffee Lab | Coffee shop | Cambridge | 42.37512 | -71.11803 | 4.7 | 846 |
| Fenway Taqueria | Mexican restaurant | Boston | 42.34617 | -71.09724 | 4.3 | 612 |
| Somerville Bakehouse | Bakery | Somerville | 42.39554 | -71.10023 | 4.8 | 398 |
| Seaport Ramen Bar | Ramen restaurant | Boston | 42.35198 | -71.04406 | 4.5 | 1,147 |
How it works
Five steps, every project
- Step 01
Tell us what data you need
Share the categories, the geography and the fields that matter for your decision.
- Step 02
We define the data scope
We translate that into a search geometry, a field list and a delivery schema, then confirm it with you.
- Step 03
We collect and process the data
Coverage is tiled across the area, records are deduplicated and addresses are parsed into components.
- Step 04
We validate the dataset
Coordinates, categories and completeness are checked, and we report what could not be found.
- Step 05
We deliver the final result
You receive the dataset in your chosen formats with a field dictionary and a coverage summary.
Pricing scales with the number of records, the number of geographies, the field list and the refresh frequency. Tell us the cities and categories you need and you get a fixed price before collection starts.
FAQ
Questions we get asked
What type of data can you collect?
Publicly visible listing attributes: business name, category, address, coordinates, phone, website, rating, review count, opening hours, price level and closure status. If a field is not published for a listing, it is returned empty rather than guessed.
Can you collect data for a specific city?
Yes. Scope can be a city, a metro area, a postcode list, a radius around a point, a drive-time isochrone or a custom polygon you supply as GeoJSON or Shapefile. We tile the search across that geometry so coverage is even rather than concentrated in the centre.
What formats can you deliver?
CSV, Excel, JSON, GeoJSON and Shapefile as standard. We can also load results directly into PostgreSQL/PostGIS, BigQuery or an S3 bucket you control.
How long does data collection take?
A single city in one category is typically ready in two to four business days. Multi-city or multi-category projects usually run one to two weeks. You get a sample of a few hundred records early so the schema can be corrected before the full run.
Can you provide recurring data collection?
Yes. Weekly, monthly or quarterly refreshes are common. Each refresh includes a change log of added, removed and modified listings so you can measure openings, closures and rating movement over time.
How accurate are the coordinates?
Coordinates come from the listing itself and are validated against the stated address. Records where the two disagree beyond a tolerance are flagged in a separate column so you can decide whether to keep, re-geocode or exclude them.
Is this legal?
We work only with publicly available information, respect the access limits of the sources we use, and decline projects that require circumventing authentication or platform protections. For anything sensitive we recommend an official API or a licensed data provider, and we will tell you when that is the better route.
More services
Often combined with
Street View Data
Large-scale street view imagery collection, processing and structured dataset delivery.
Learn MoreSemantic Segmentation
Pixel-level image analysis that turns imagery into counted, measured classes.
Learn MorePOI Data
Business and point-of-interest records with categories, coordinates and attributes.
Learn MoreKeep exploring
Where to go next
Related services
- POI DataBusiness and point-of-interest records with categories, coordinates and attributes.
- Location IntelligenceLocation-based market, catchment and competitor analysis that ends in a recommendation.
- Web ScrapingCollect structured data from websites and public sources, on a schedule you control.
- Map VisualizationInteractive maps and data visualization built for clarity and fast loading.
Related reading
Next step
Have a specific data requirement?
Tell us the geography, the fields and the cadence you need for google maps data. You get a scoped plan, a sample and a fixed price before any work starts.